Basic structure
An E-R diagram consists of the following major components:
-
Rectangles divided into two parts: Represent entity sets. The first part contains the name of the entity set. The second part contains the names of all the attributes of the entity set.
-
Diamonds: Represent relationship sets.
-
Undivided rectangles: Represent the attributes of a relationship set. Attributes that are part of the primary key are underlined.
-
Lines: Link entity sets to relationship sets.
-
Dashed lines: Link attributes of a relationship set to the relationship set.
-
Double lines: Indicate total participation of an entity in a relationship set.
-
Double diamonds: Represent identifying relationship sets linked to weak entity sets.
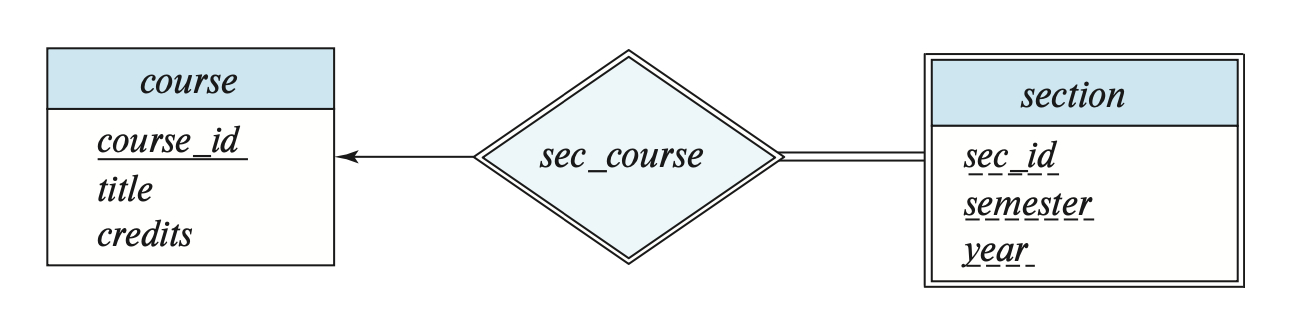
Mapping Cardinality
To distinguish among different mapping cardinalities, either a directed line , signifying ‘one’, or an undirected line , signifying ‘many’, is drawn between the relationship set and the entity set.
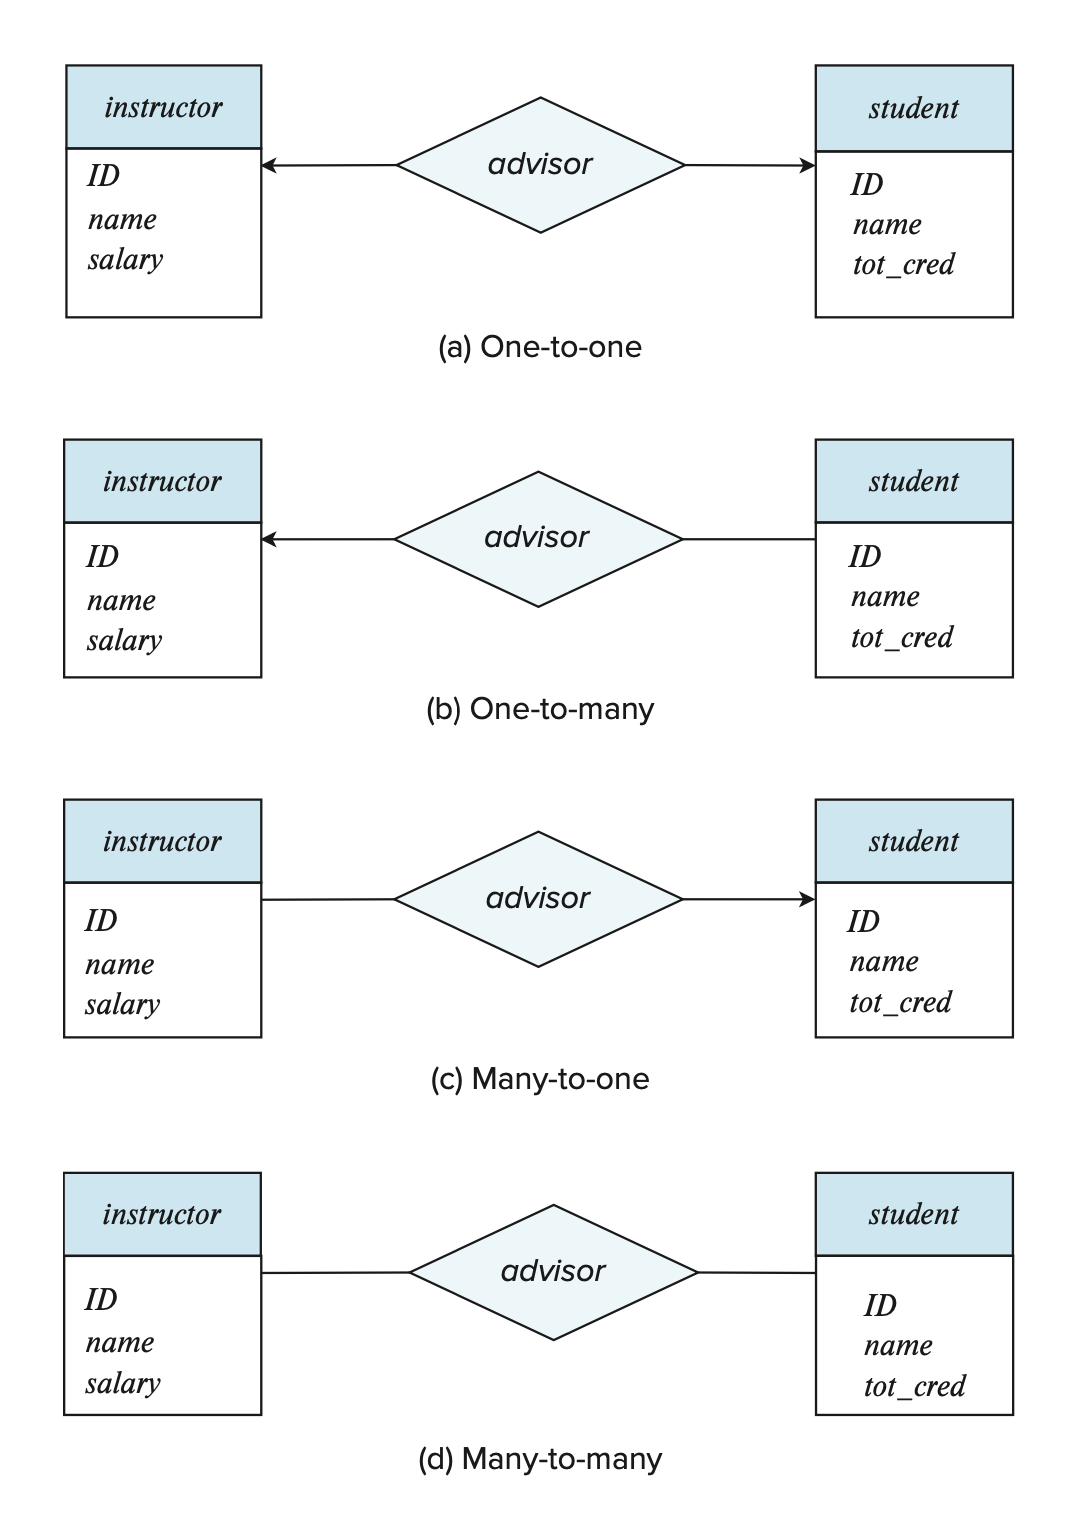
E-R diagrams also provide a way to indicate more complex constraints on the number of times each entity participates in relationships in a relationship set.
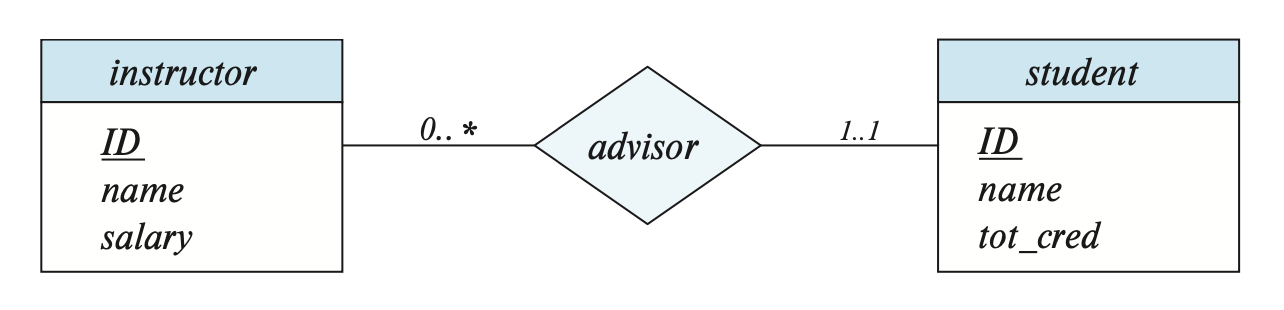
A line may have an associated minimum and maximum cardinality, shown in the form , where is the minimum and is the maximum capacity. The sign indicates ‘no limit’.
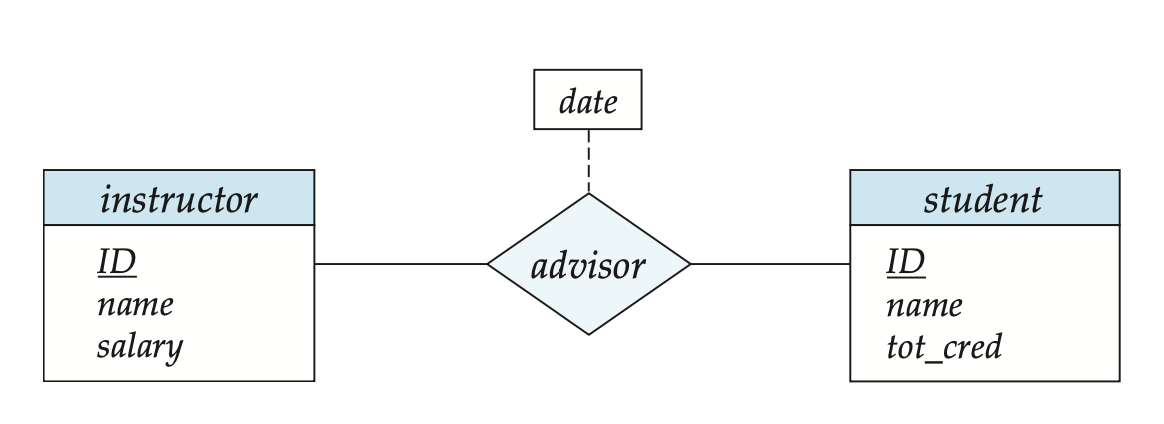
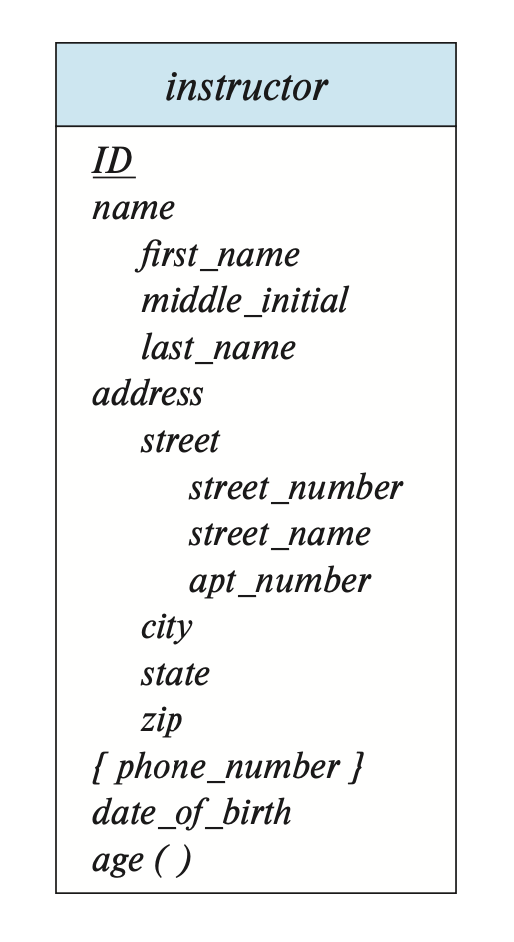
Complex attributes
E-R diagrams can also describe complex attributes.
Composite attributes and component attributes are distinguished with indentations. Component attributes that consists the composite attributes are given directly below the composite attribute with an indentation.
Multivalued attributes are written inside curly braces .
Derived attributes are written with an additional parentheses at the end.
Roles
Roles are indicated in E-R diagrams by labeling the lines that connect diamonds to rectangles.
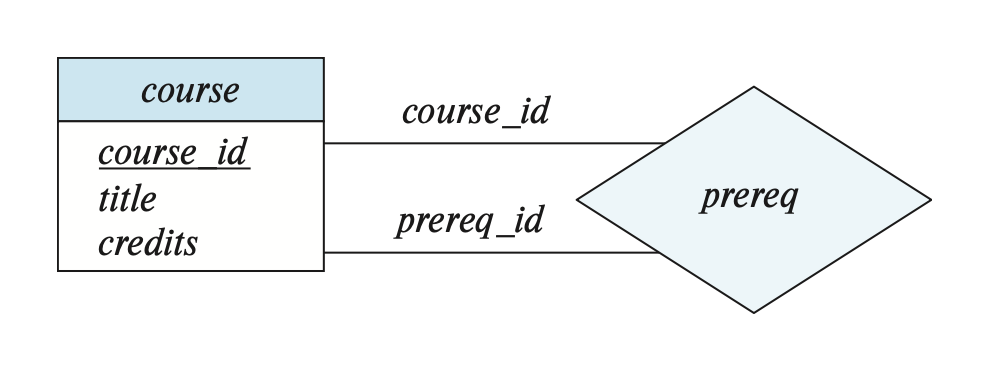
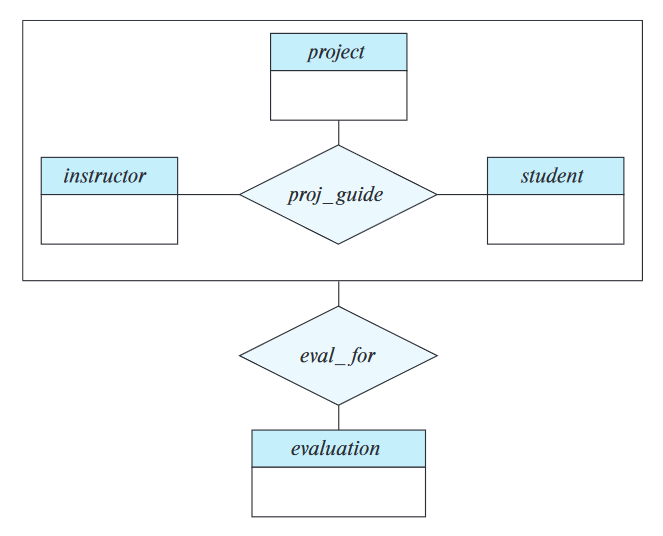
Nonbinary relationship sets
At most one arrow out of a ternery (or greater degree) relationship is allowed to indicate a cardinality constraint.
If there are more than arrow, there are two ways of interpreting the meaning. Suppose that there is a relationship set between entity sets , and the only arrows are on the edges to entity sets .
- A particular combination of entities from can be associated with at most one combination of entities from .
- i.e., the primary key for the relationship can be constructed by the union of the primary keys of .
- For each entity set , each combination of the entities from the other entity sets can be associated with at most one entity from .
- i.e., Each set , for , forms a candidate key.
Functional dependencies allow either of these interpretations to be specified in an unambiguous manner.
Weak entity sets
In E-R diagrams, a weak entity set is depicted via a rectangle, like a strong entity set, but there are two main differences:
- The discriminator of a weak entity is underlined with a dashed line.
- The relationship set connecting the weak entity set to the identifying entity set is depicted by a double diamond.
Specialisation
- Specialisation is depicted by a hollow arrow-head pointing from the specialised entity to the other entity.
- This relationship is referred to as the ISA relationship, which stands for ‘is a’.
- e.g.,
instructor‘is a’employee.
- e.g.,
- For overlapping specialisation, two separate arrows are used.
- For disjoint specialisation, a single arrow is used.
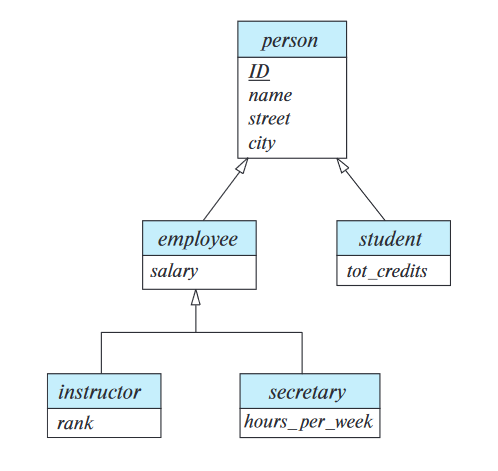
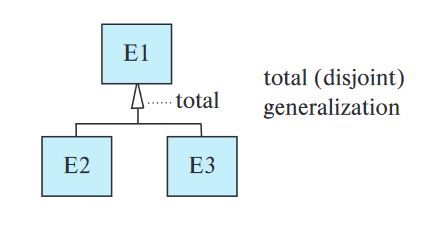
Completeness constraint
- Total generalisation is specified in an E-R diagram by adding the keyword ‘total’ in the diagram and drawing a dashed line from the keyword to the corresponding hollow arrow-head(s).
Aggregation
- Aggregation is specified by drawing a rectangular box around the relationships treated as a higher-level entity.